Dynamics 365 Tracing and InRule Event Logging
Dynamics 365 Plug-In Trace Logging
The Dynamics Plug-In Trace Log feature is a debugging tool made available within Dynamics itself for reviewing plugin events and exceptions. This section will highlight how to enable this feature within Dynamics and how to utilize it. Currently, Plug-In Trace Logs only work with the Execution Service in online deployments. For more detail on the limitations of on-prem deployments, reference Known Issues, Limitations and Troubleshooting.
Enable Plug-In Trace Log
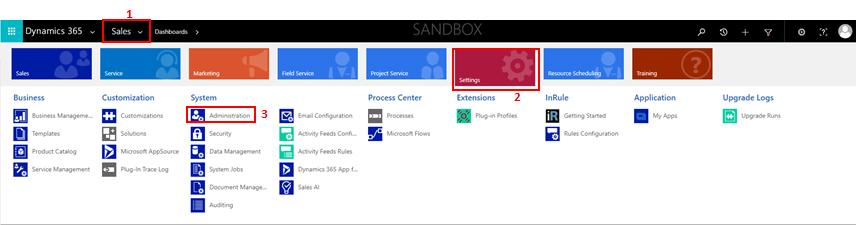
To enable the Plug-in Trace Log, first navigate to Settings > Administration.
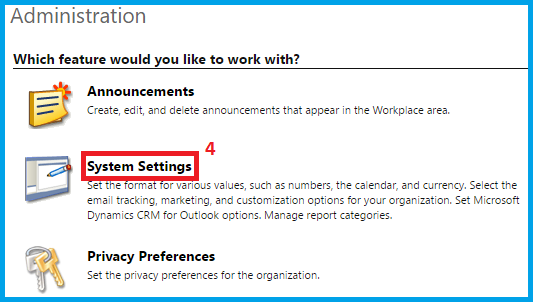
Once you're in the Administration section, click on System Settings.
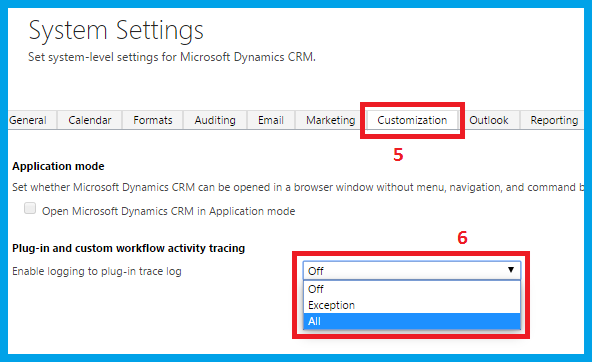
From here you can navigate to the Customization tab and select All for the Enable logging to plug-in trace log field. Then click OK. This will create trace logs for all plugin events within your Dynamics environment. In the context of InRule, this includes Create, Update, and Custom Action events.
Viewing Plug-In Trace Log
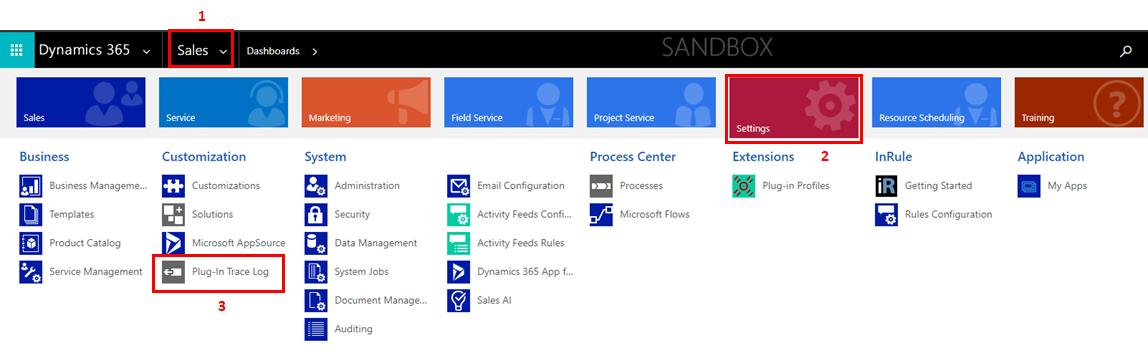
To review Plug-In Trace Logs after they have been enabled, navigate to Settings > Plug-in Trace Log.
Here, there will be a list populated with all logged plugin events. If you do not see a list of logs in a similar fashion as below, that means no plugin events have been logged.
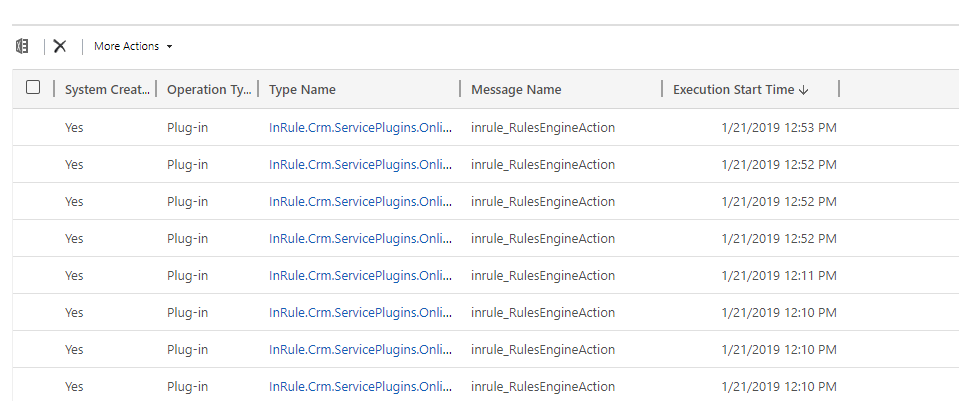
For this example, we will view the resulting log of executing a Custom Action from manually running rules. To view a specific log, simply click on the hyperlinked Type Name text.
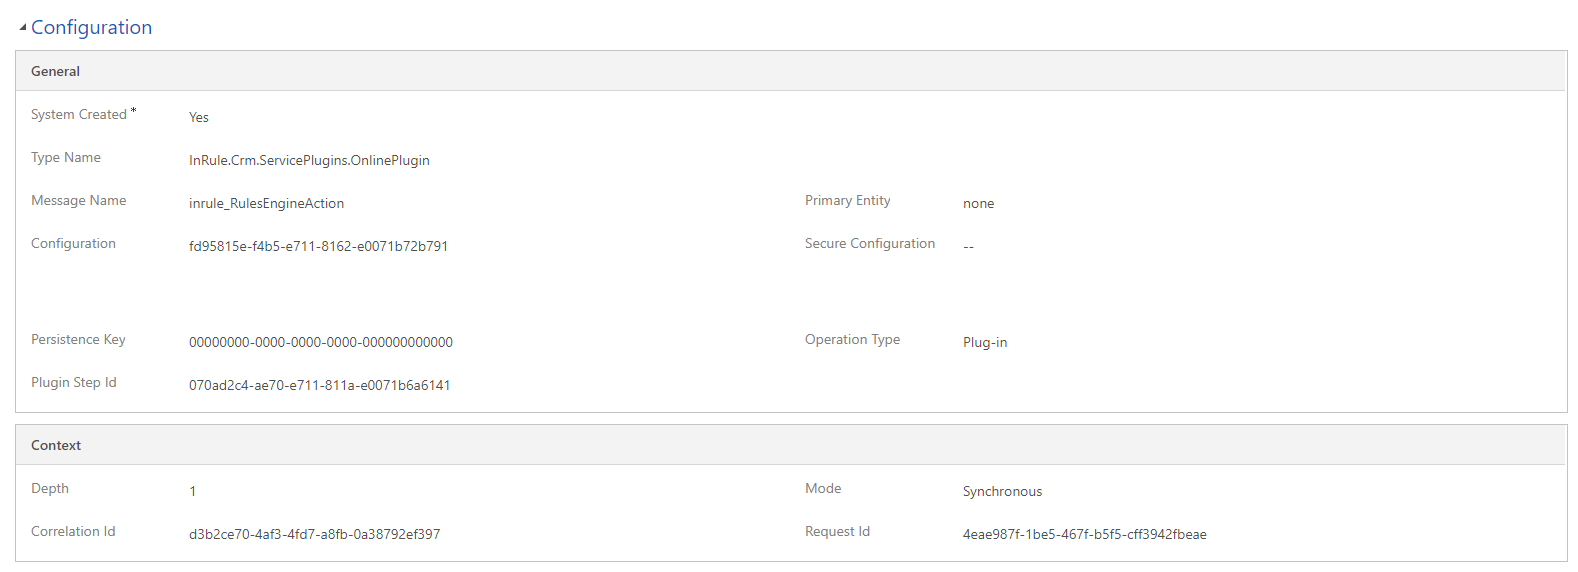
The first section within a specific trace log is the Configuration section, which details the various configuration details about the event, including the Rule Configuration ID used, the event type, the plugin step ID, and more. This section can be useful for debugging by providing a quick means of determining whether or not the rules executed were properly configured.
The second section, the Execution section, is typically the most useful for debugging. It will provide a block of all messages logged by the plugin during its execution, as well as any exception details, if the event resulted in an exception.
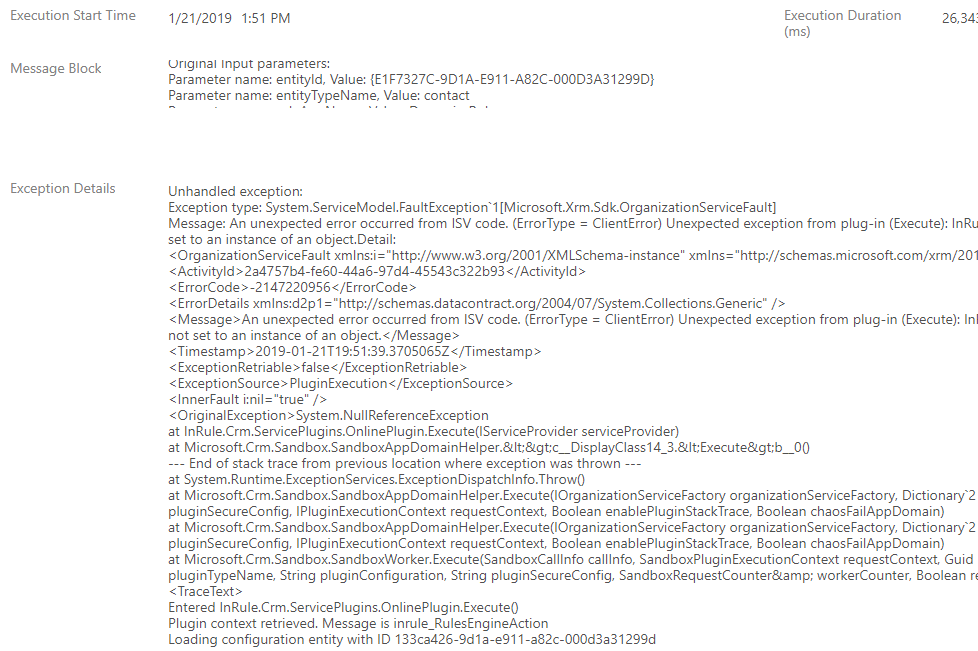
The message block logs rule execution "milestones." In the event that the plugin fails to execute properly, the message block is useful for determining at what point it is failing. The Exception Details block will provide any related details to any exception thrown and is generally the first place to look to diagnose the nature of a plugin execution failure.
Additionally, when interested in performance information, the application logs will also provide insight into data loading time. As can be seen below, this is broken up into total loading time, which is how long the entire loading process takes with internal processing included, total org time, which is strictly the summed total of all entity loading times, and then loading times for each collection loaded. This will also display the total number of entities in each collection.

Rule Execution Service Event Log
Event logging can be enabled in the Rule Execution App Service to monitor application events. These logs can be tremendously useful for debugging any issues encountered with the Rule Execution Service.
Configuring Event Logging Levels
The Application Event Log can quickly become bogged down with too many logs, making finding specific logs that you may be interested in more difficult. To cut down on excessive informational logs, the Rule Execution Service, by default, will be deployed with a logging level of "Warn," meaning only Warnings and Errors will be logged. However, this can be adjusted as needed for whatever your needs may be.
To adjust your Rule Execution Service's logging level, navigate to your App Service as created as a part of the Azure deployment process detailed in Rule Execution App Service for Dynamics 365
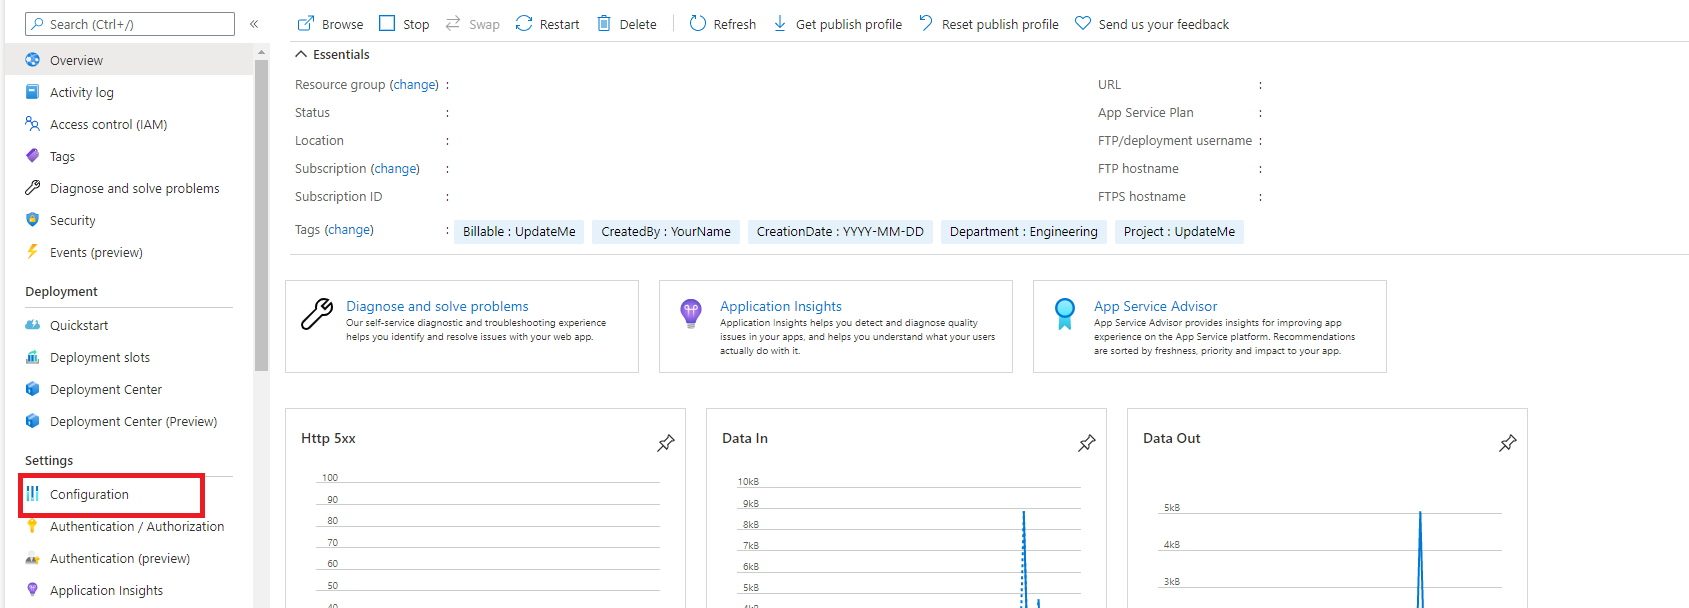
Once you're looking at the overview of your app service, select Configuration in the settings menu:
Scroll down until you see the Configuration section:
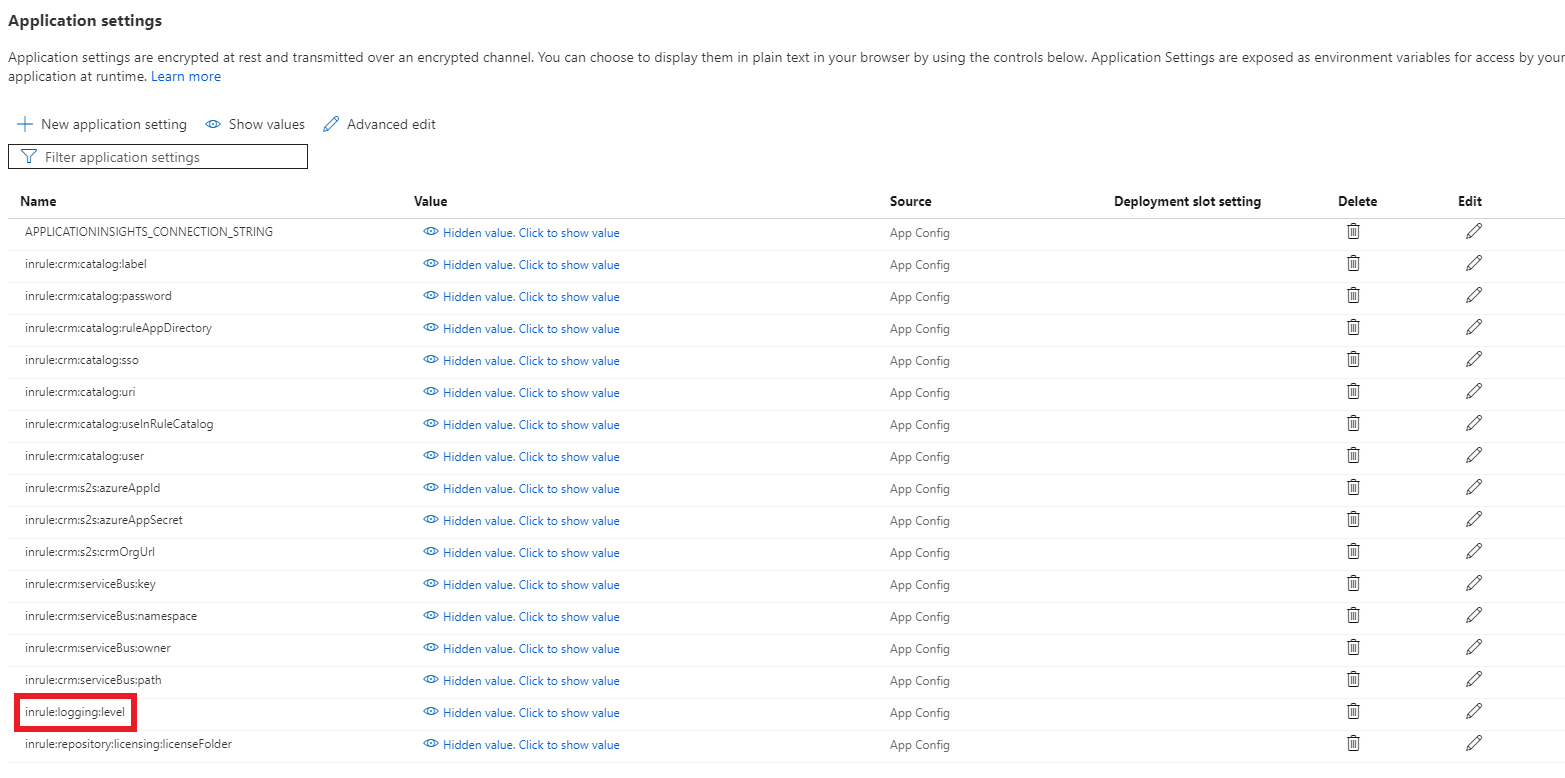
Locate the inrule:logging:level setting. Note that its value is currently set to "Warn."

Simply change the value to the desired logging level. You may select from one of the following levels that the Rule Execution Service leverages:
| Logging Level | Details |
|---|---|
| Info | Logs all application events, including Informational events that track the general flow of the application |
| Warn | Logs Warning and Error events. Warning events highlight abnormal or unexpected events in the application flow, but don't otherwise cause application execution to stop |
| Error | Logs only Error events. Error events result in the halted execution of the application's current activity due to a failure |
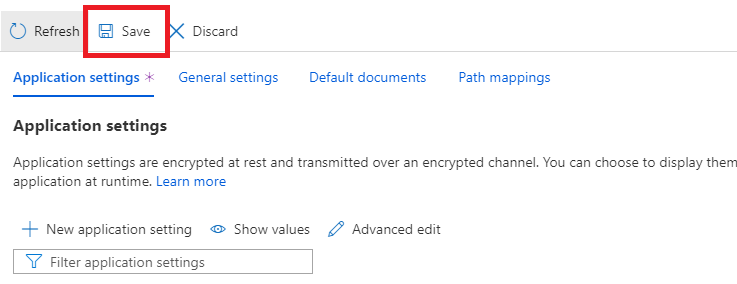
Once you have configured the setting to the desired level, press Save at the top of the page:
Viewing Application Event Logs
To view event logs, login to Azure and navigate to your App Service as created as a part of the Azure deployment process detailed in Rule Execution App Service for Dynamics 365.
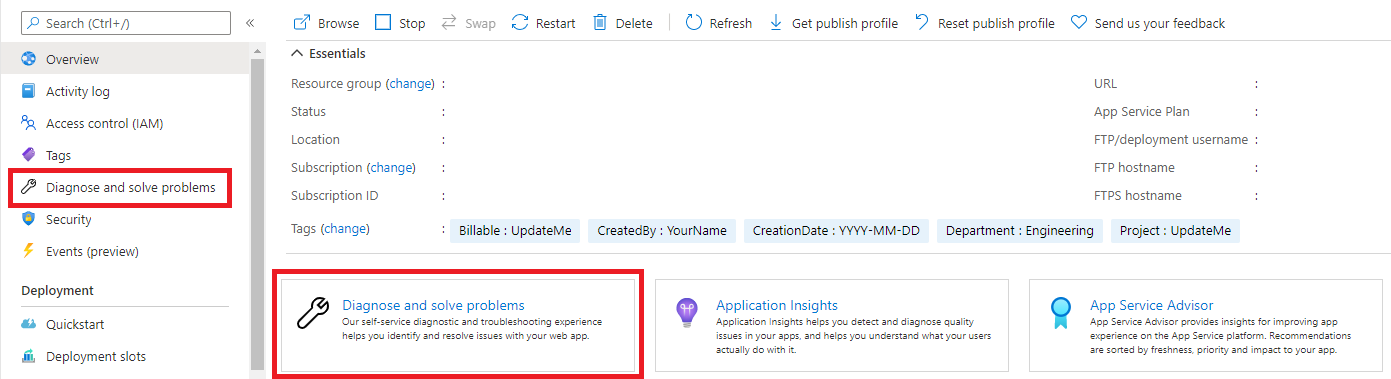
Once you're looking at the overview of your app service, select Diagnose and solve problems
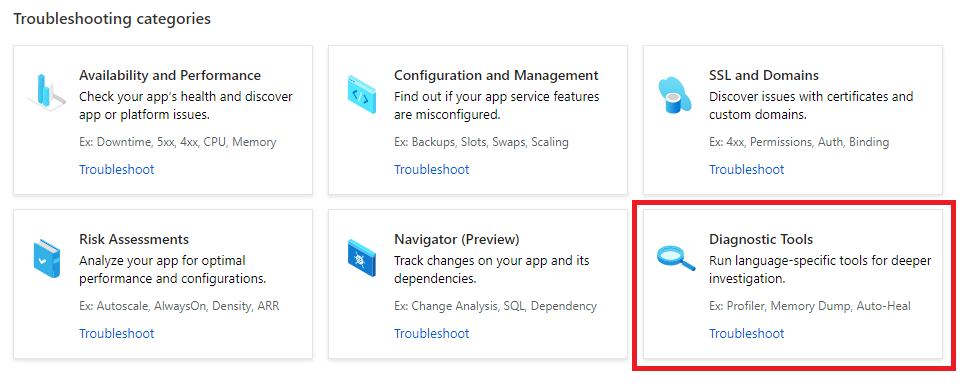
Select Diagnostic Tools
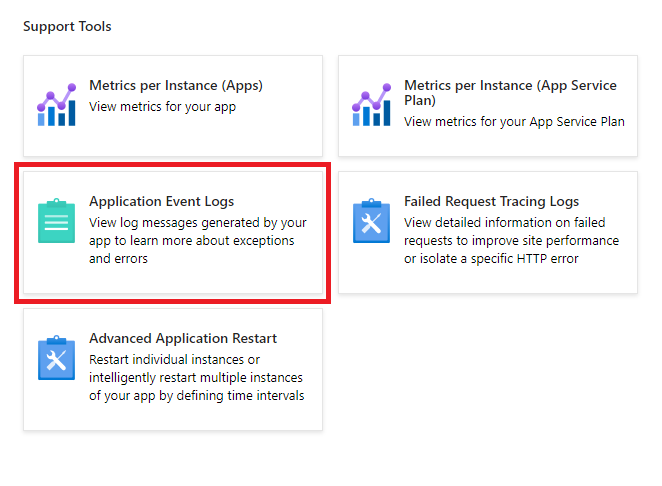
Select Application Events Logs
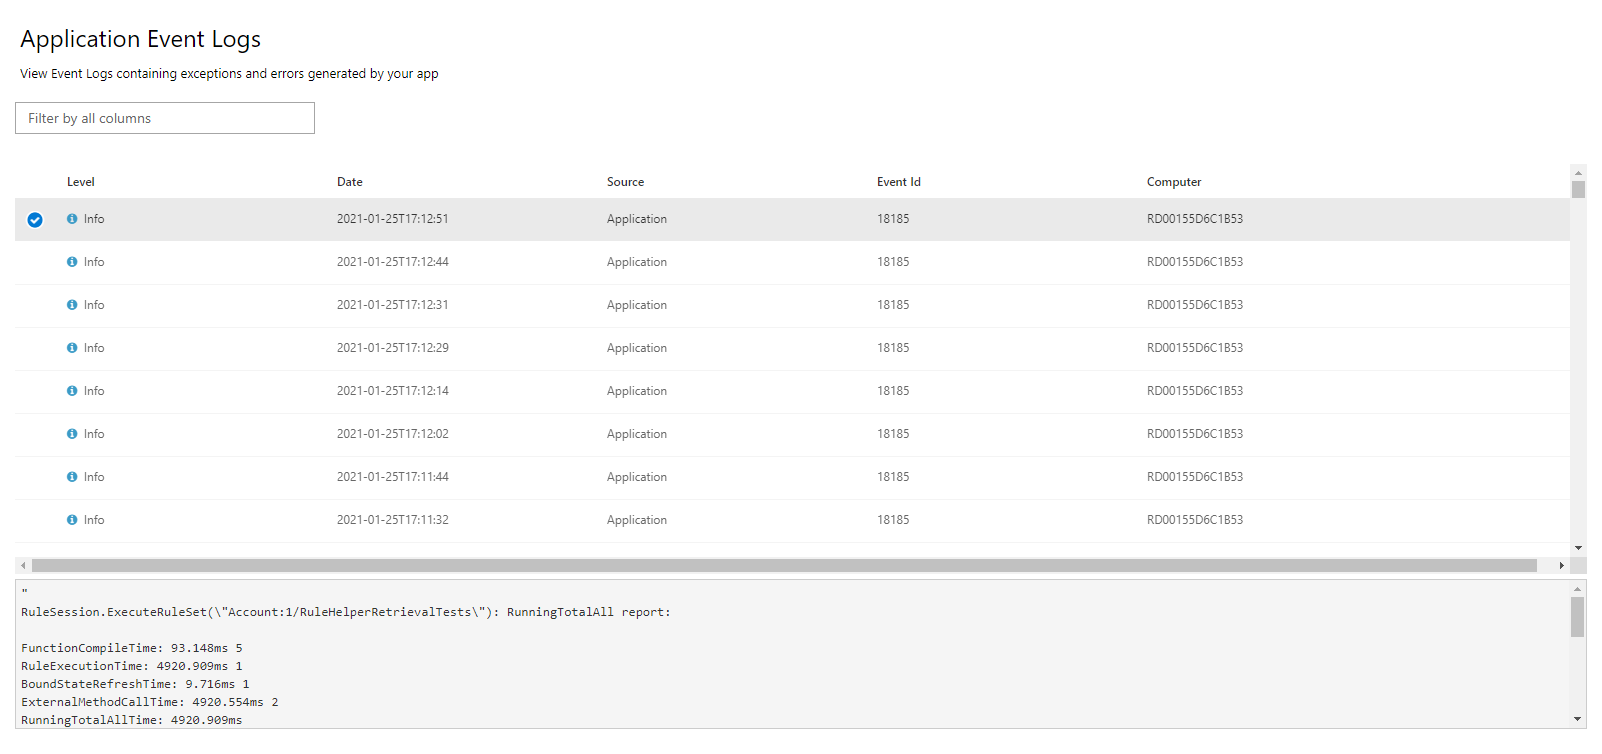
You should see a list of all application events logged by the rule execution service, denoted with the notification level, timestamp, source, event ID, and web server. Selecting an event log will cause the log details to appear below the list of logs.
In the event of rule service issues, error events in this log stream can be useful for debugging purposes. For example, below is an example of an error event log in an instance where the rule service contacting the catalog looking for a rule application that didn't exist:
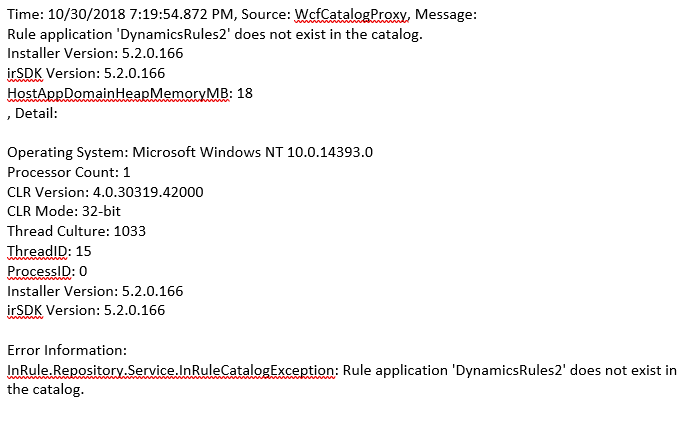
Typically, the response message at the beginning of the log and the Error Information section provides the most pertinent debugging information.