Introduction to Runtime Analytics
Runtime Analytics allows users to visualize execution trends with details such as endpoint latency, request counts, errors, spikes, and more. The source data for runtime analytics is based off InRule runtime event logging which captures detailed telemetry on the various stages of rule execution. The detailed runtime logs can be accessed in the SaaS Portal under Settings -> Provisioned Resources -> provisioned-resources#logging. These logs can be very large and difficult to decipher which is why Runtime Analytics will continue to evolve to address usability.
Key Features
- Ability to track execution trends across rule applications, performance spikes, outliers, compilation, and aggregate execution metrics across time windows
- Interactive filtering and drill-down
- Capability to export the Dashboard to pdf/image
- Data synchronization collected across tenant instances with minimal delay
- Easily access the dashboard from the portal
Overview
Provides a high-level summary of key runtime metrics in a single scroll-able dashboard with filtering and drill-down capabilities.
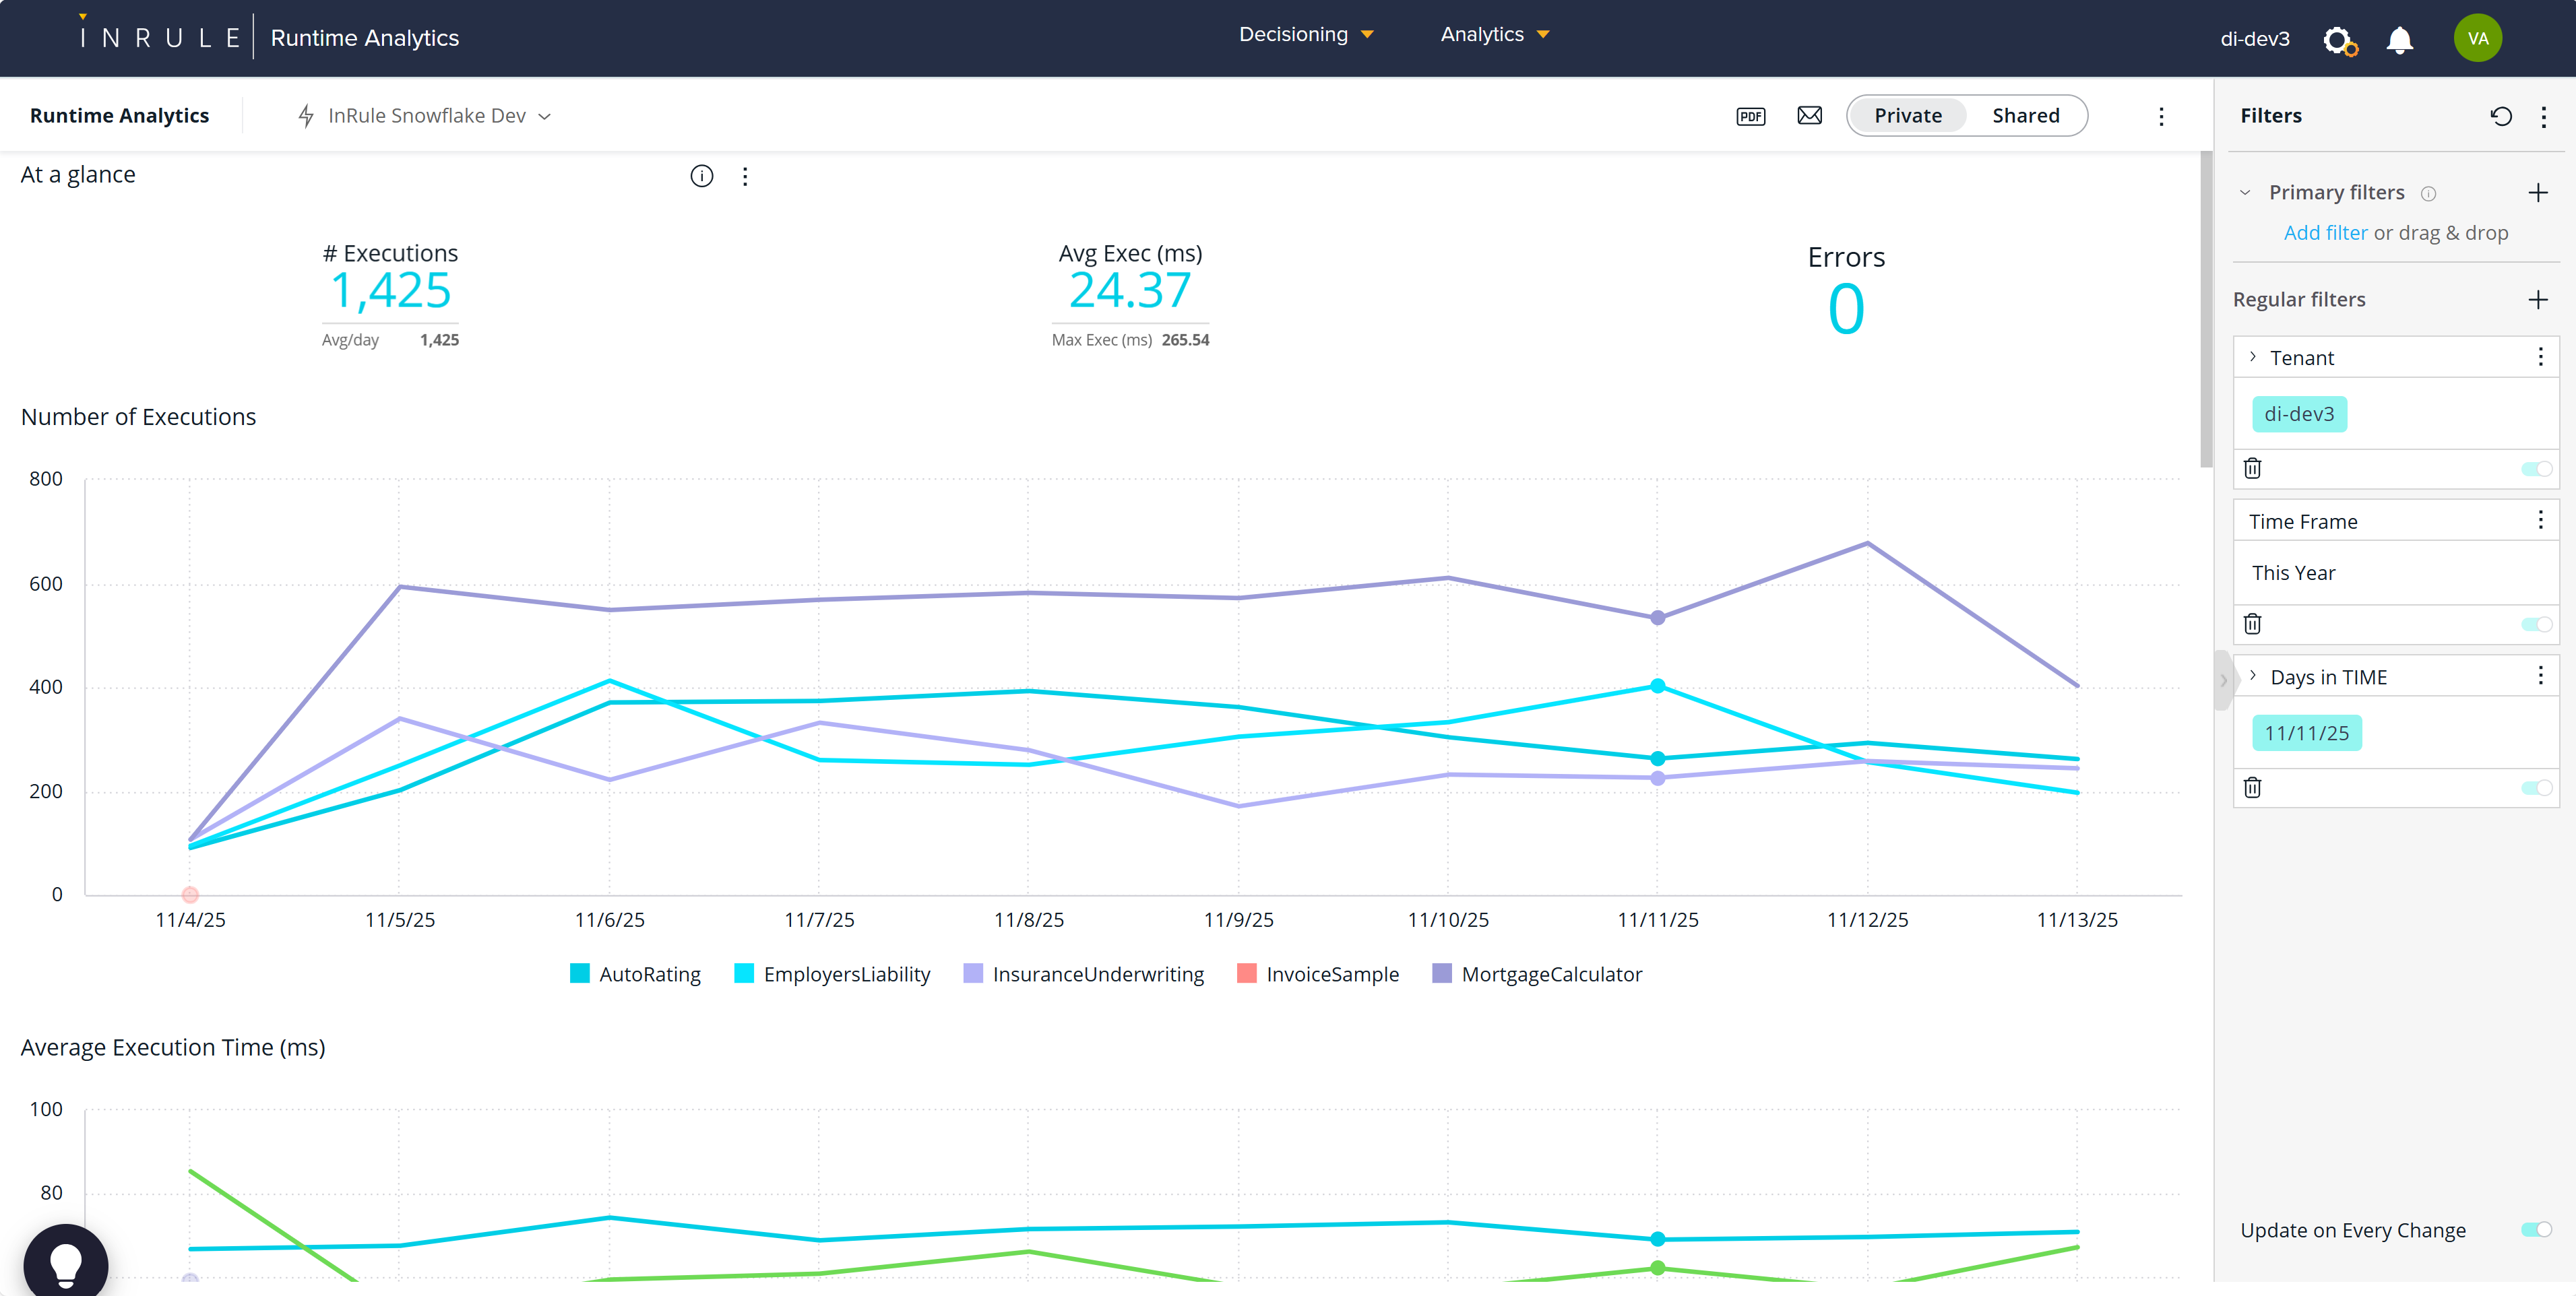
At a Glance
High-level counters for a quick look at total executions, average execution time, and errors. This is handy when used with the global filter to narrow down by weeks, months, and other user-selectable time windows.

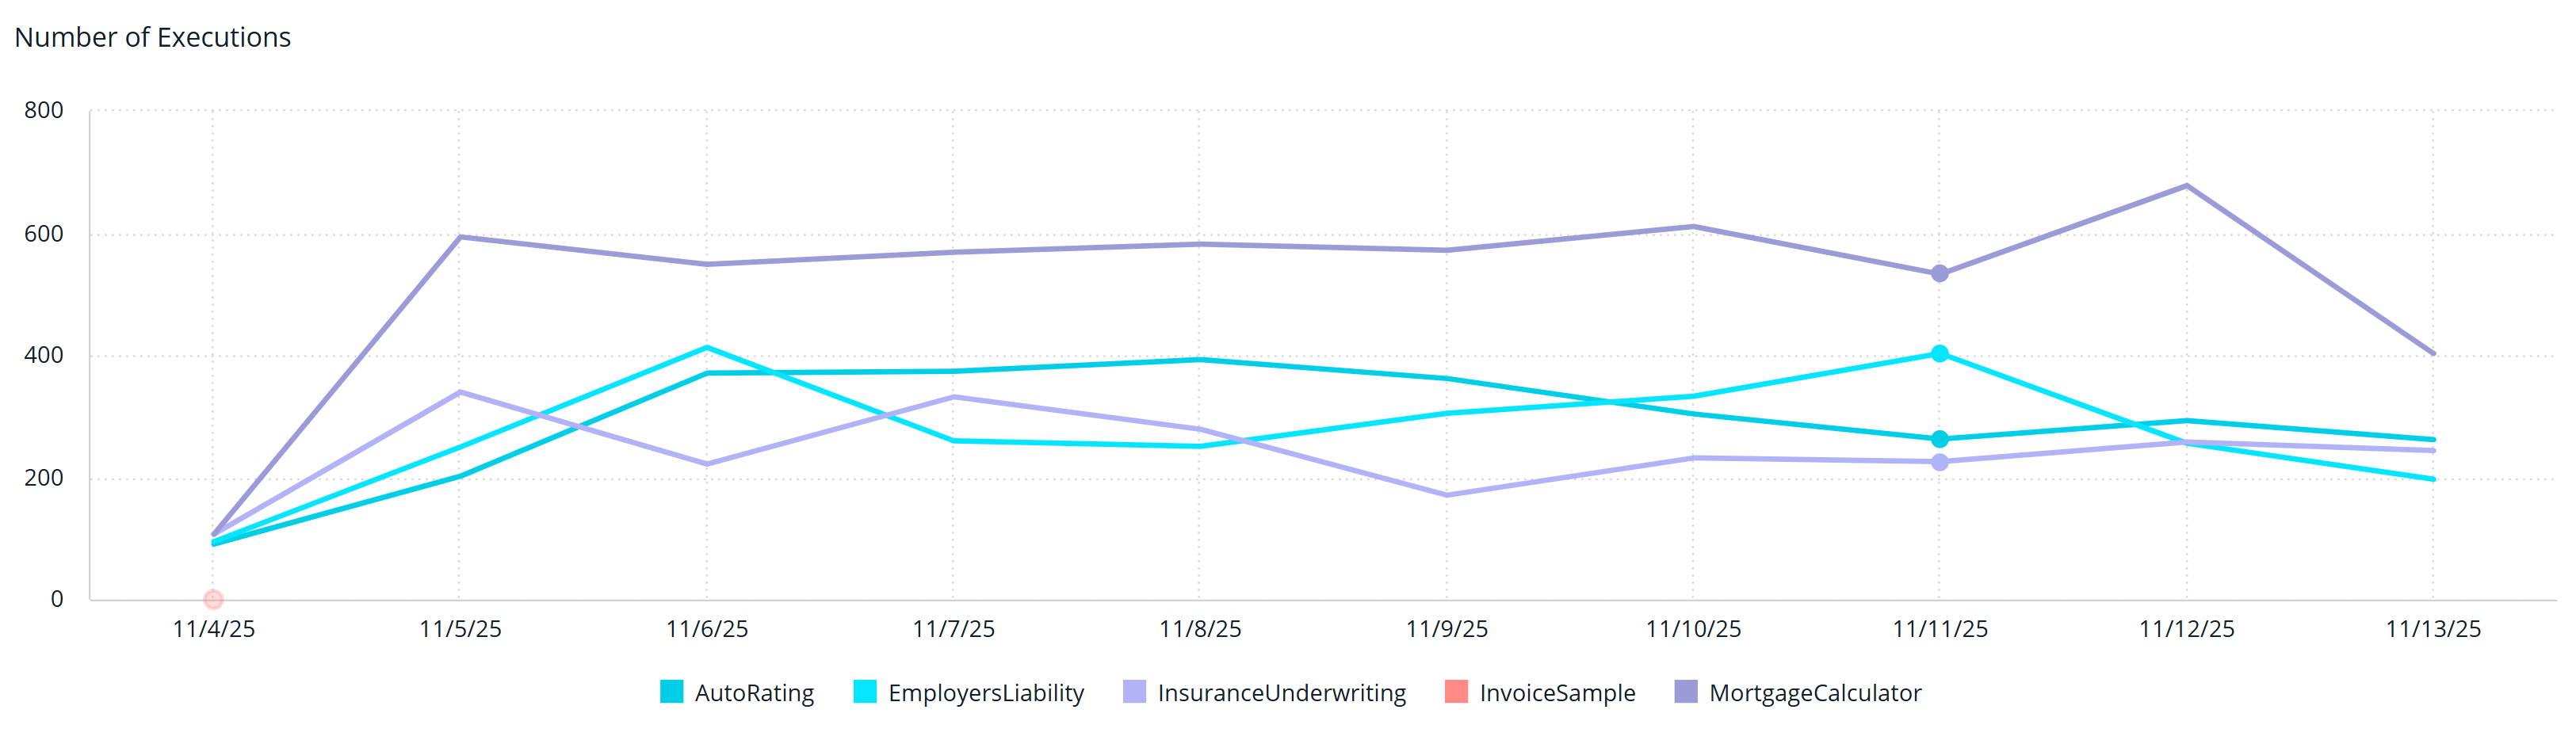
Number of Executions
Displays the total number of rule engine executions by rule application over time. This is useful for understanding transaction loads and spikes.
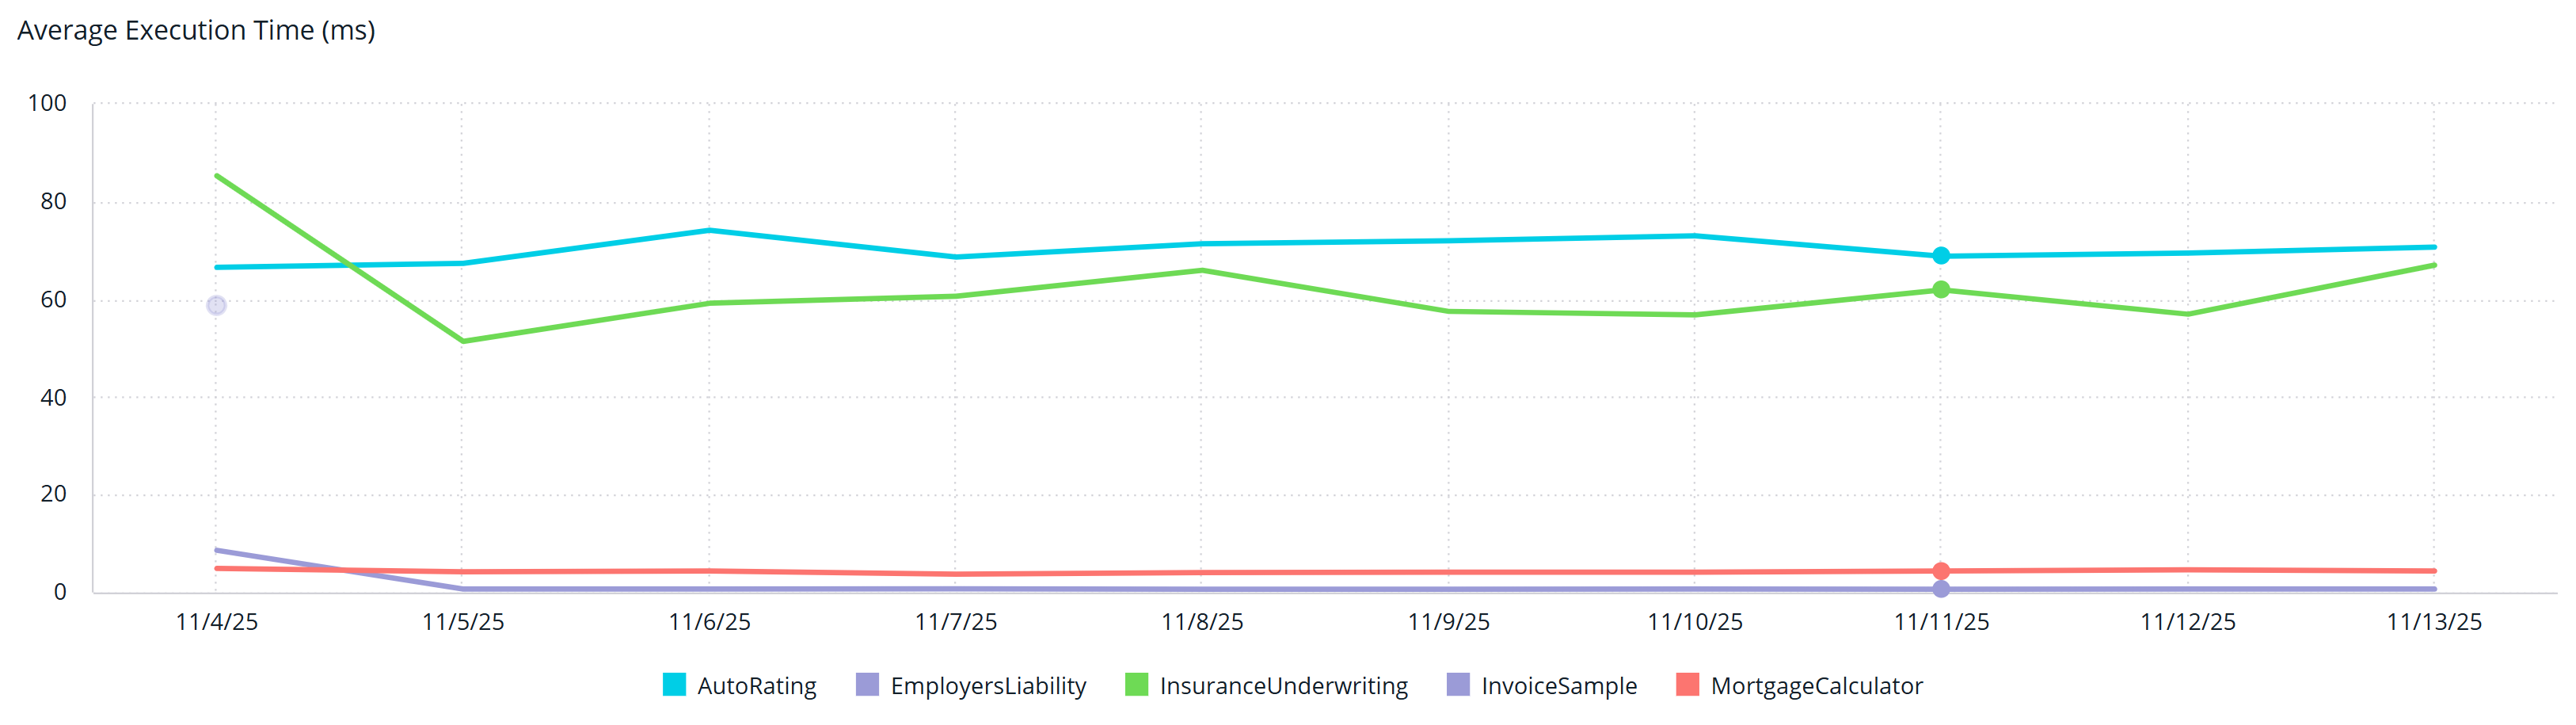
Average Execution Time
Displays the average execution time by rule application over time. Execution time can vary from # of rules triggered, amount of request data, external calls and concurrent transaction load. When correlated with other counters, you can begin to form an execution performance profile along with expectations for scaling.
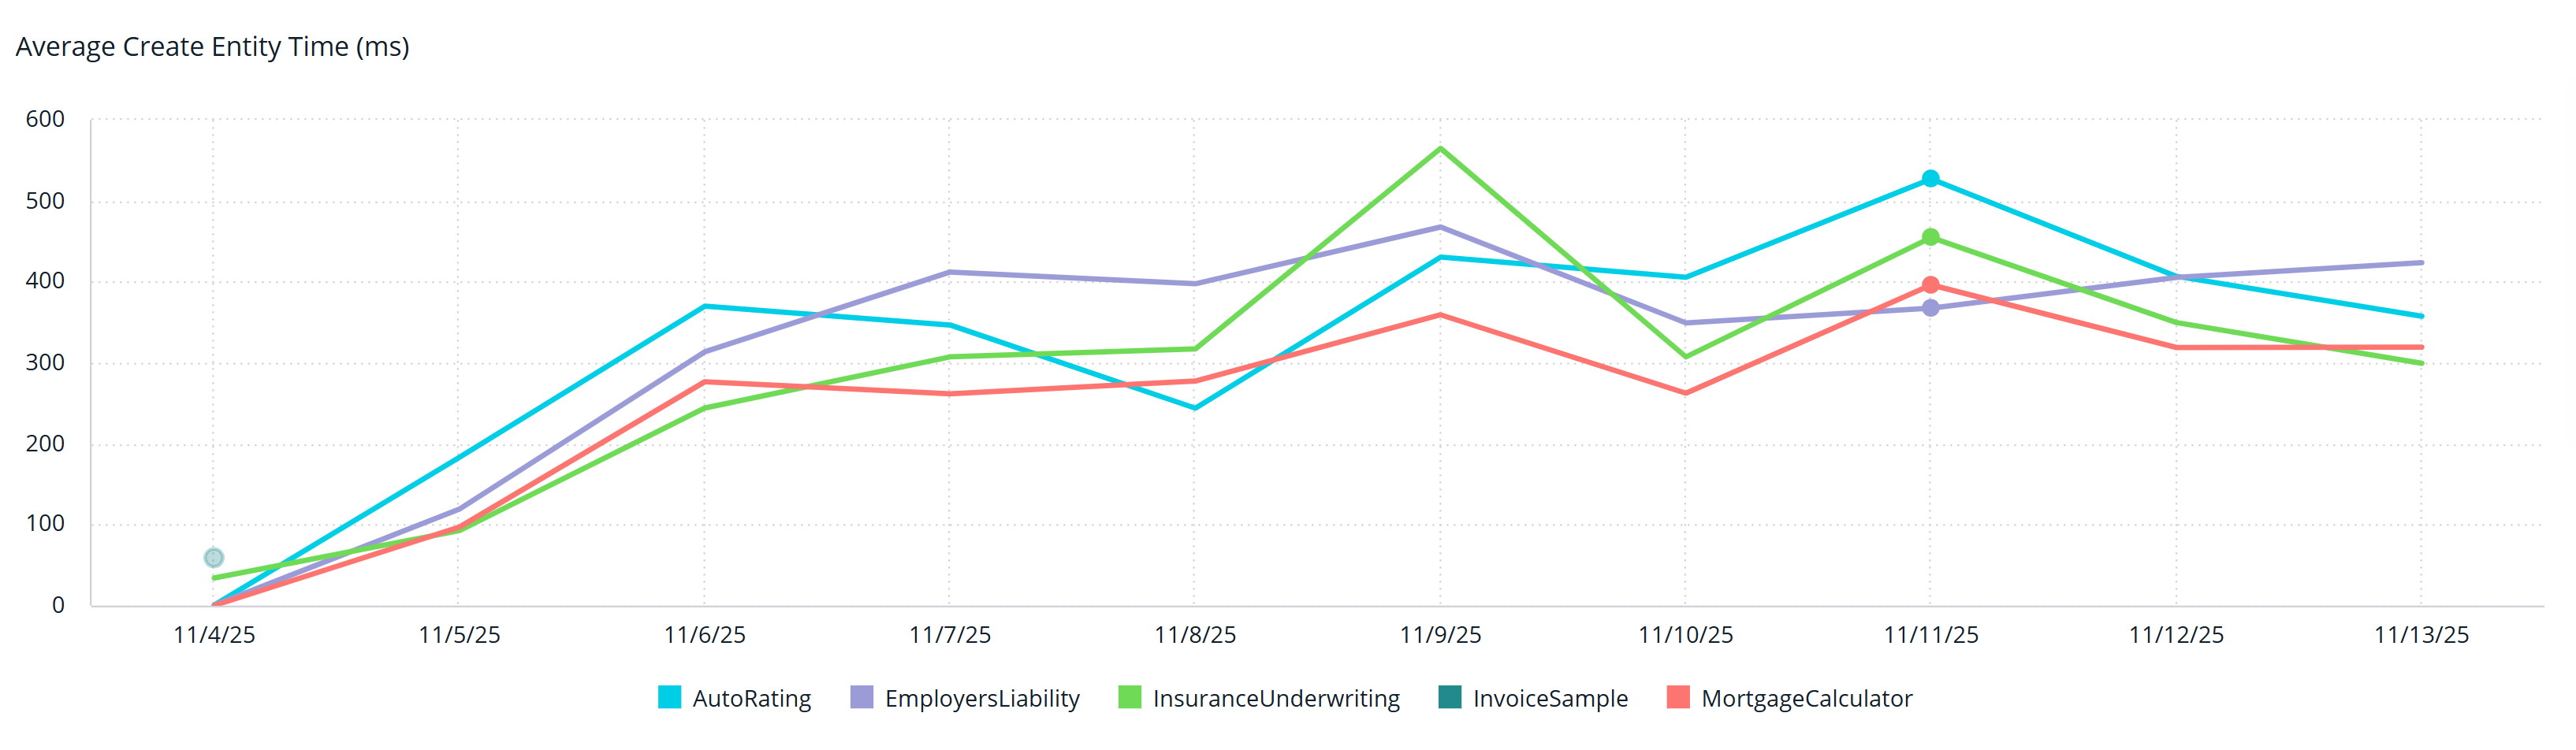
Average Create Entity Time
Displays the create entity time by rule application over time. This represents the time to load the json request request data into entity state. This counter should be usually be in the low milliseconds even for moderate sized datasets.
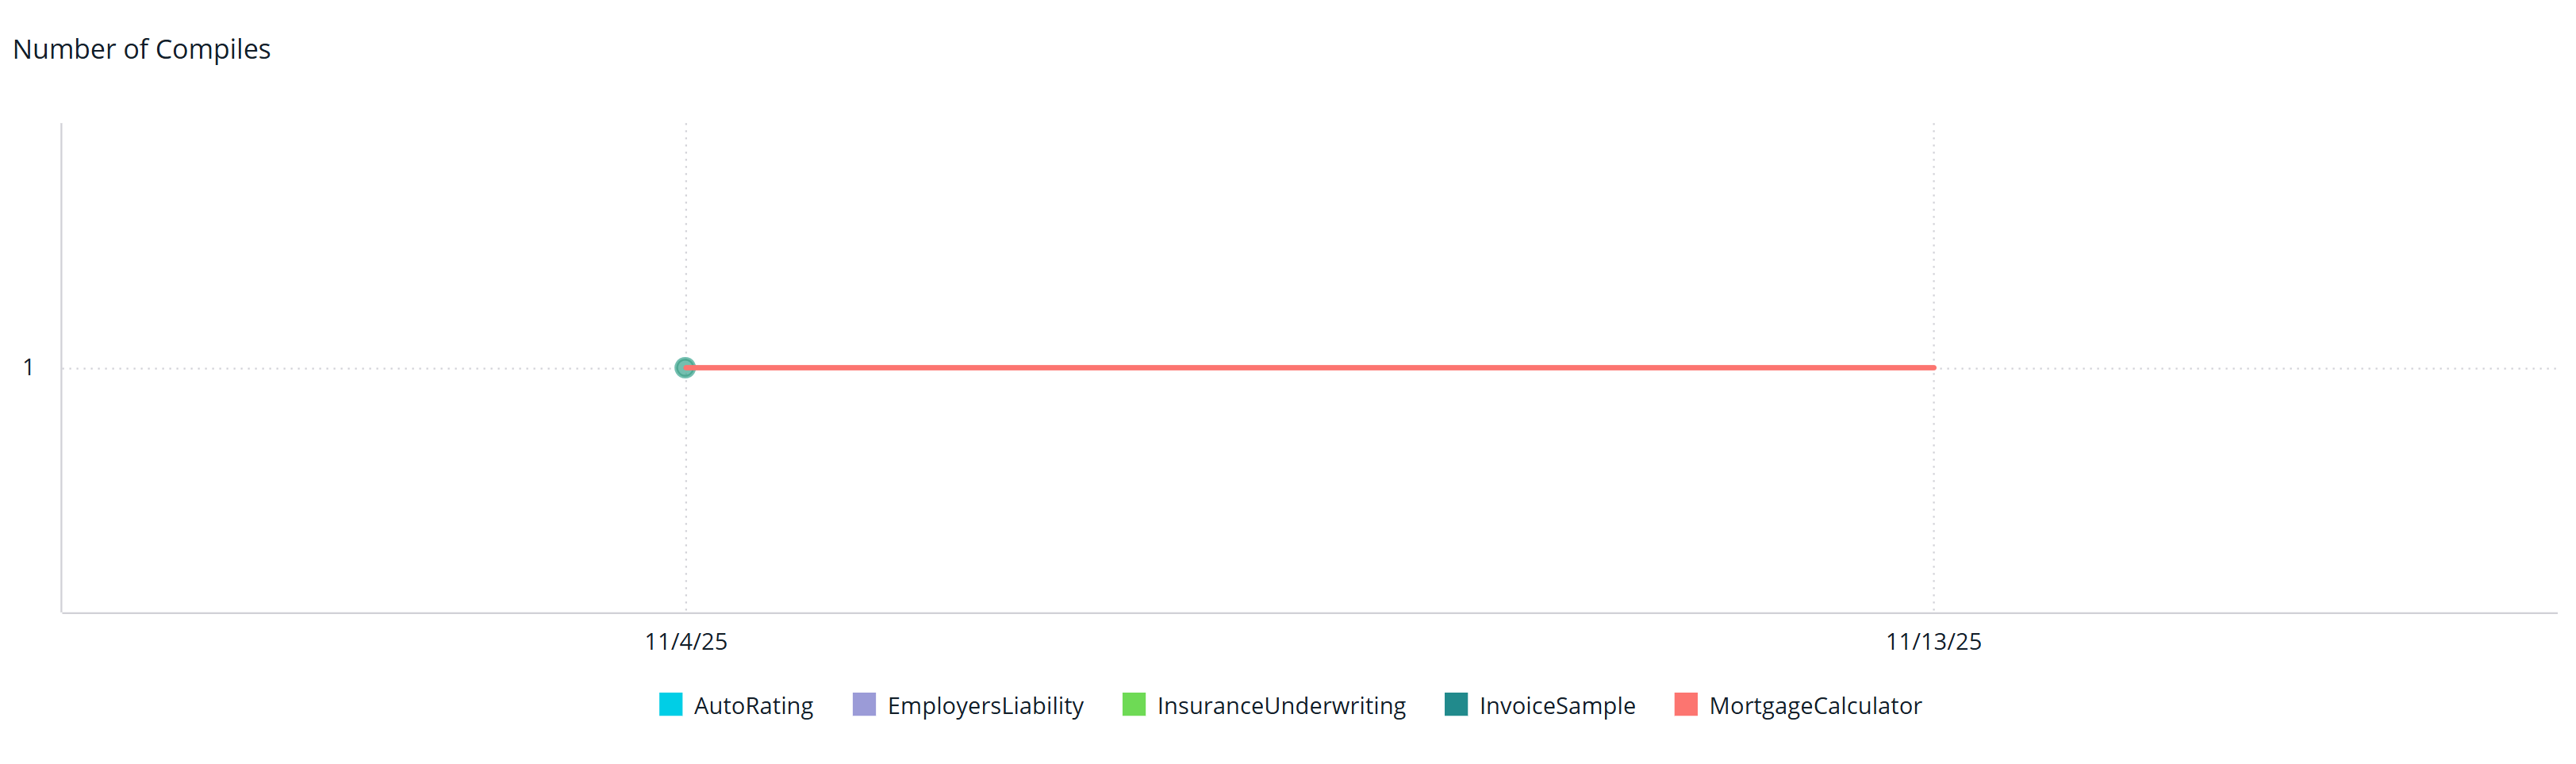
Number of Compiles
Displays the number of compiles by rule application over time. Typically, compiles are only triggered by checked in rule applications, but service scaling can be another cause. High numbers of unexplained compiles may need to be investigated as they can severely impact performance.
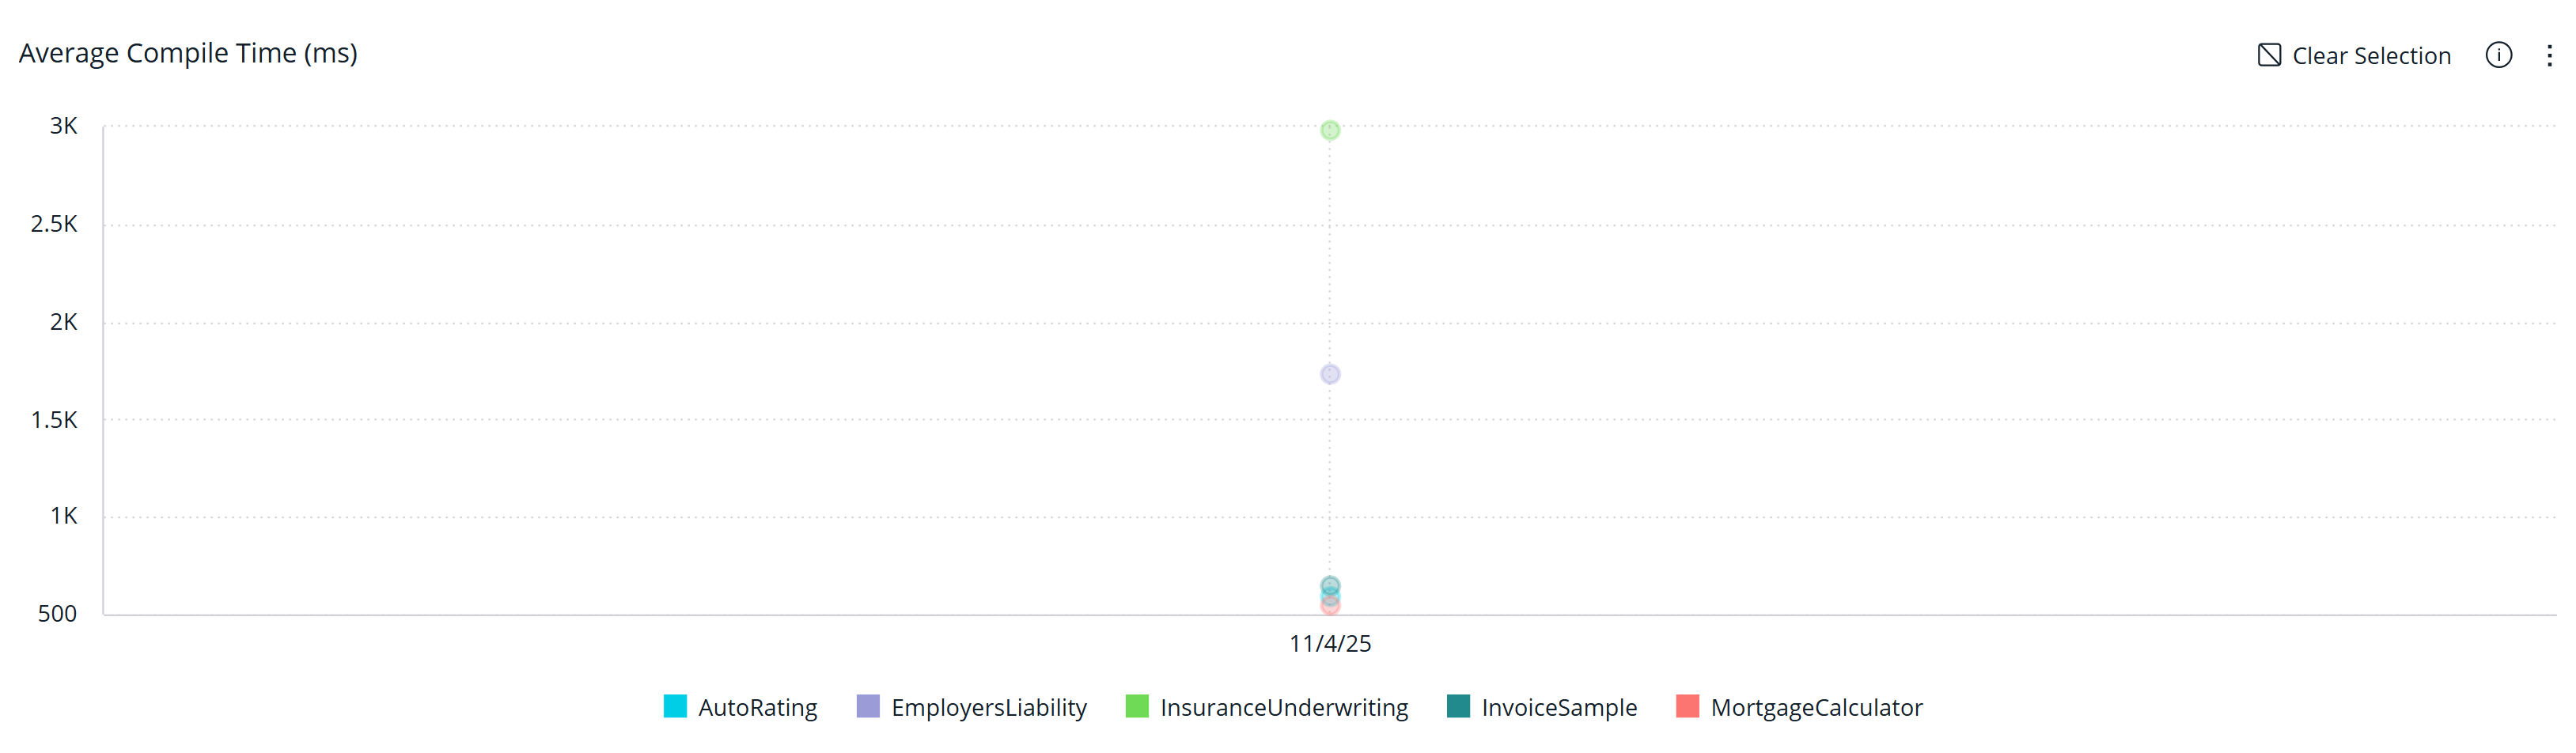
Average Compile Time
Shows how long rule applications take to compile over time.
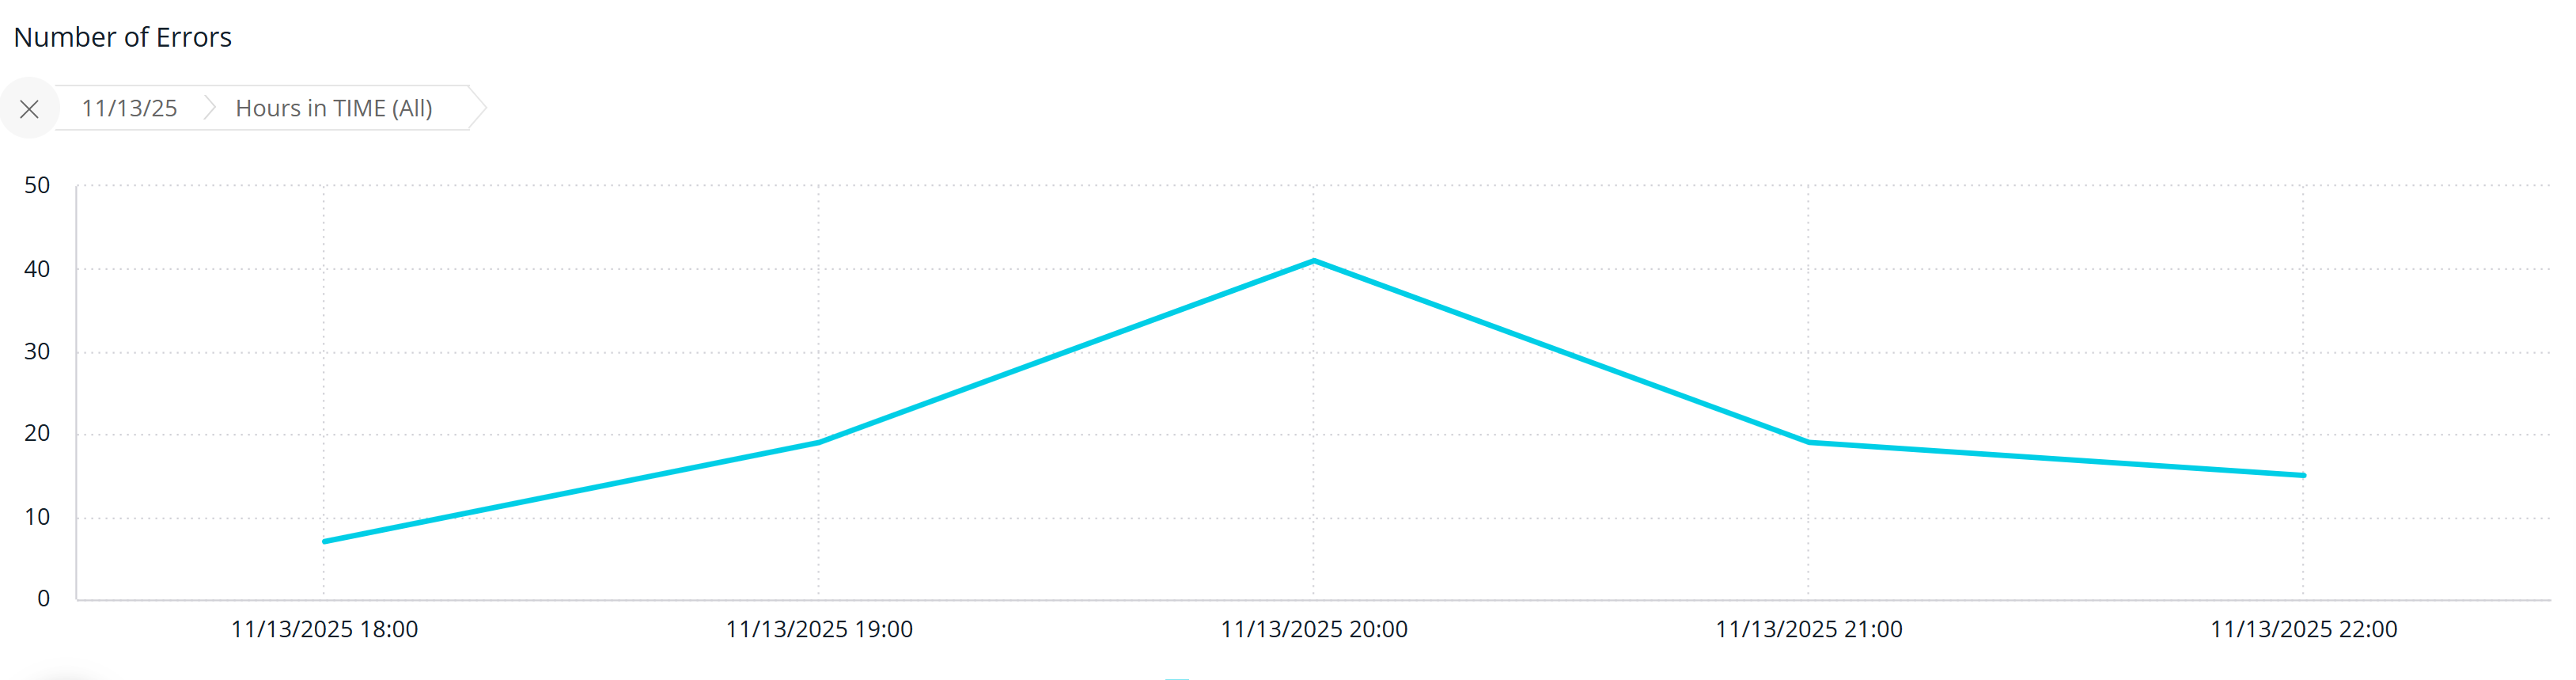
Number of Errors
Shows the count of execution errors by rule application over time. The actual error message still needs to be obtained from the detailed event logs, but this feature may get added to the dashboard in a future release.