Filtering and Drill-down
This guide explains how to use the Runtime Analytics dashboard more effectively by applying global filters and performing time-based drill-down analysis.
Using the Global Dashboard Filter
The global dashboard filter allows you to narrow the dashboard view for all widgets based on time windows, rule applications, rule sets, and other attributes.
Below is an example walk=thru of filtering the dashboard to show only activity for this week.
Steps to Filter by “This Week”
To filter the dashboard so it displays only the activity for This Week, follow these steps:
-
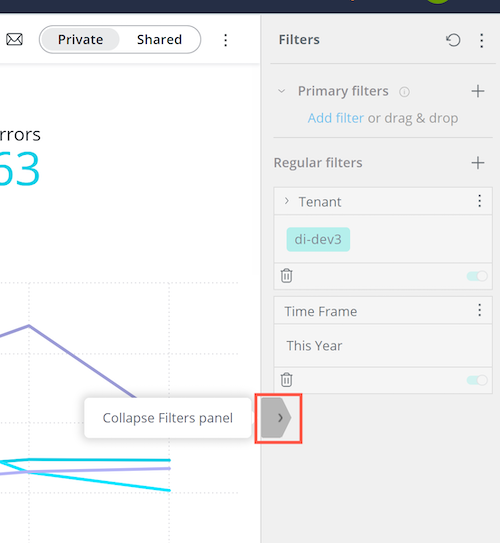
Click on the expand/collapse arrow located in the middle of the right side of the dashboard to expand the filter panel if it is not already open.
 .
. -
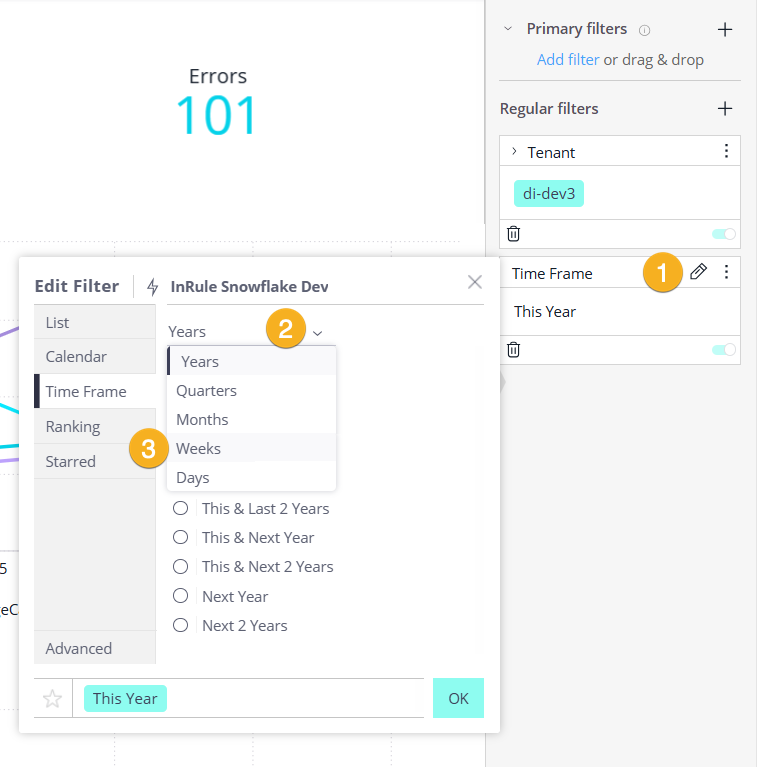
Click the pencil icon (1) next to the Time Frame filter to open the filter editor. In the filter editor, open the dropdown (2) and change the time grouping from Years to Weeks (3).
-
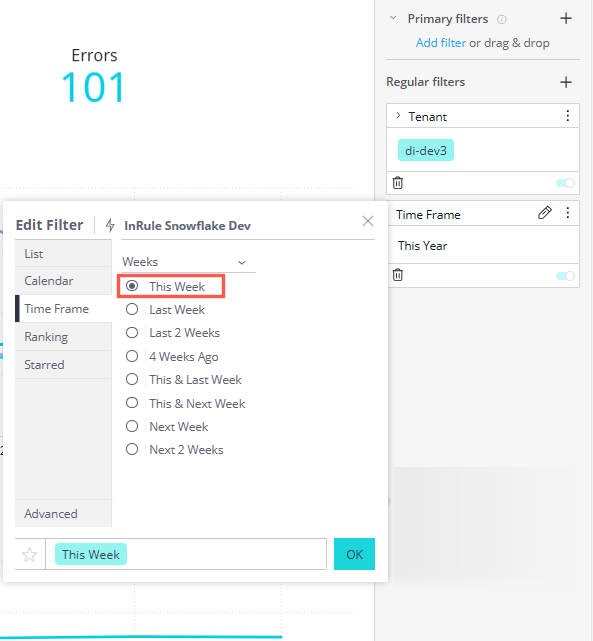
Select This Week from the list of week-based options, then click OK to apply the filter.'
-
All graphs and counters will display data for the last week. Once applied, the dashboard will refresh and display execution, compilation, and error data for the current week only.
Drill-down by Time
The dashboard supports drill-down capabilities that allow you to explore data at finer time intervals (hour, minute, and other).
This is especially useful for investigating spikes or performance anomalies.
Drill-down by Minute
The drill-down feature lets you analyze execution activity at a more granular time interval.
Follow these steps to drill into per-minute execution data.
-
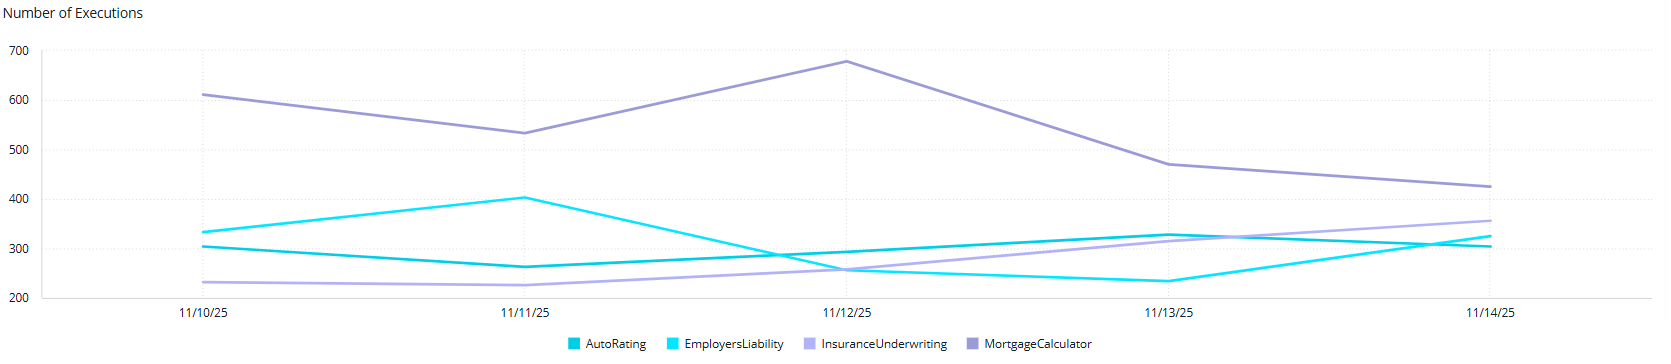
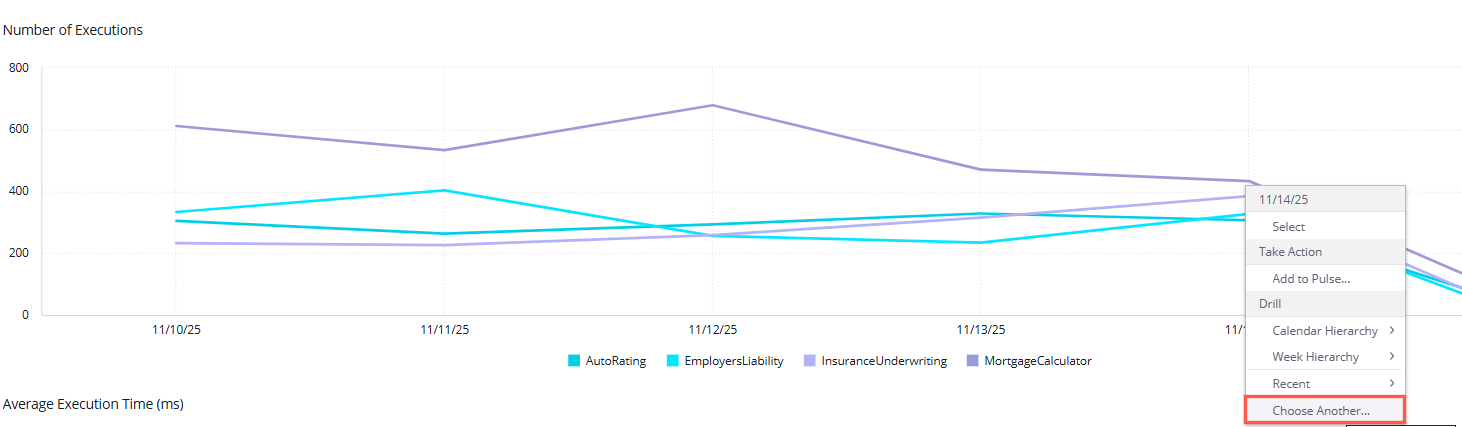
On the Number of Executions widget, right-click on a chart line for the day you want to drill into, then select Choose Another… from the drill-down dialog.
-
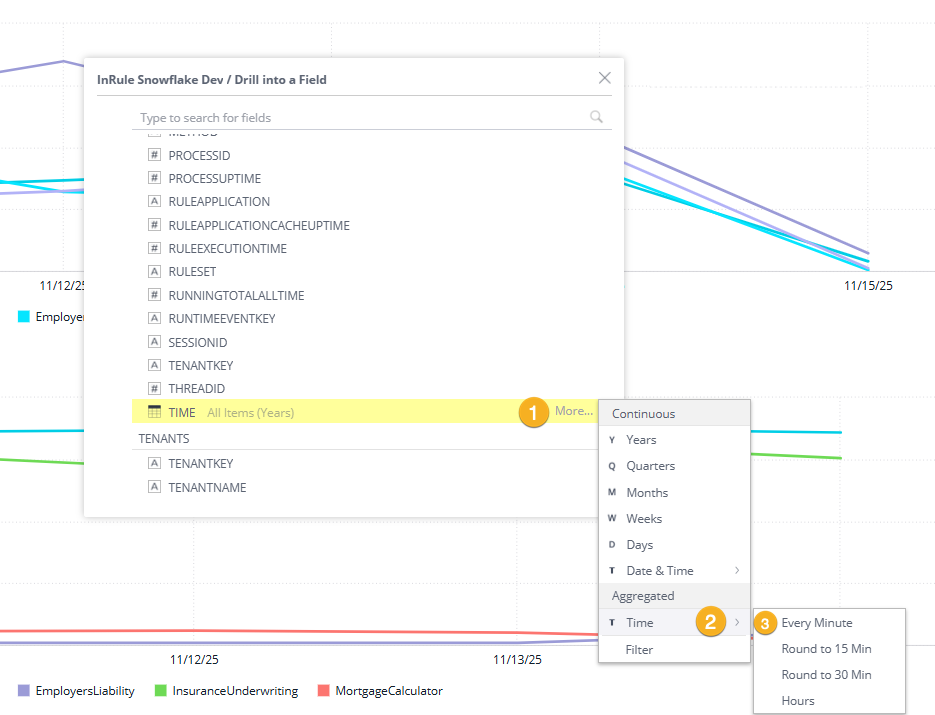
In the drill-down dialog, scroll down to the RUNTIMEEVENTS table and continue to the TIME field, select More… (1), and from the Time sub-menu (2), choose Every Minute (3).
-
This changes the granularity of the graph to show data per minute.
-
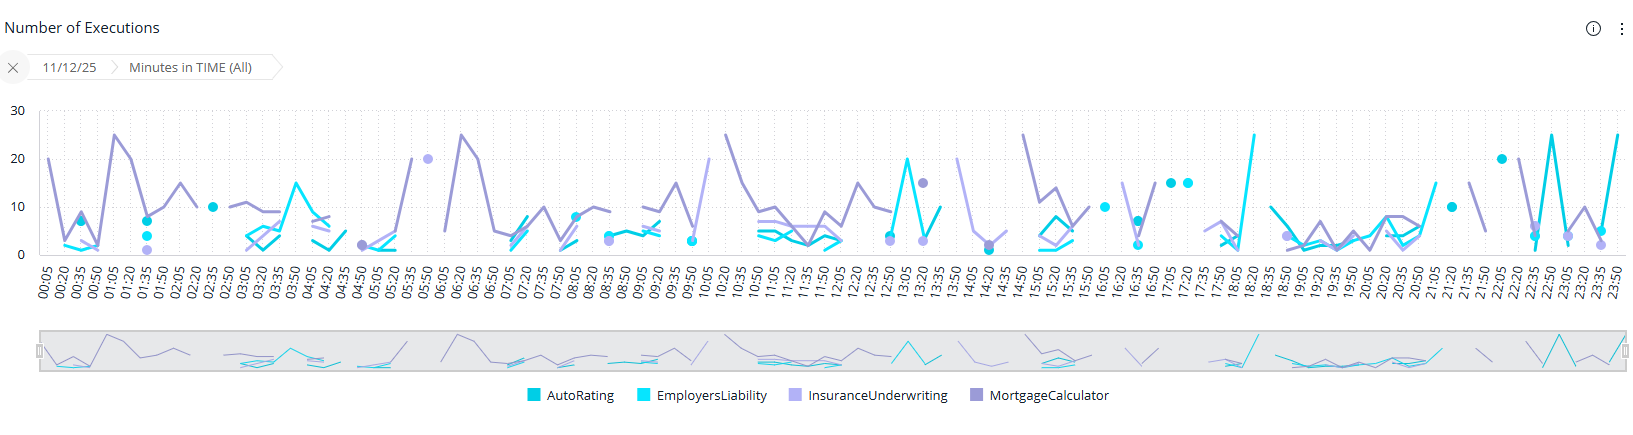
Once applied, the widget updates to display execution counts for every minute during the selected day. The Graph shows data by the minute.
-
(Optional) To return to the standard dashboard view, click the X on the minute-level filter breadcrumb.
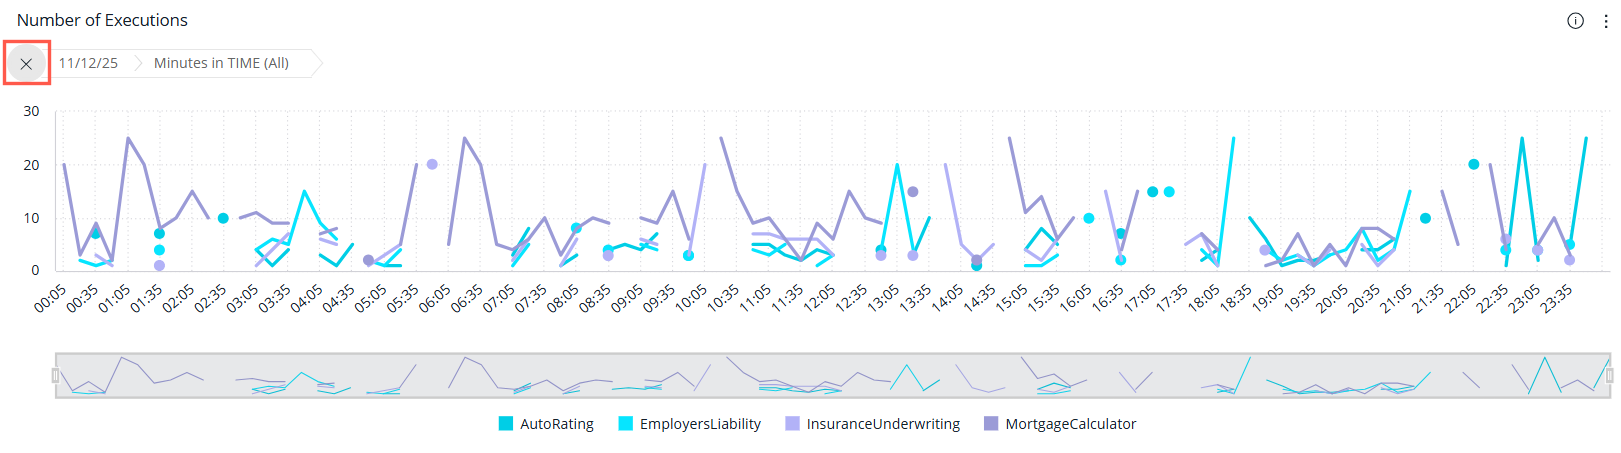
You can now analyze execution spikes, performance anomalies, or unusual behavior at the minute level, providing deeper insights into runtime activity.
Summary
Using filtering and drill-down features helps you investigate usage spikes, identify errors within specific time windows, and better understand runtime behavior across applications and environments.